
Did you download the Email Emoji Cheat Sheet? If so, then you might also remember @dataNeel’s research on combined Emoji usage in subject lines. His map is cool on its own, but even cooler now that he also published a Gephi export of the network in the comments section, so that everyone can play with the data.
Gephi is a popular free network visualization tool. I used it for example to create this and this plot of email experts on Twitter. It’s rather intuitive and comparably fast, so give it a try. Want something more programmatic? Then you should go on to Python and/or R. Followers of this blog already know R and its superb visualization and data shaping capabilities.
Here’s one example of how you can use R to explore @dataNeel’s Emoji network.
The output: 17 Emoji communities
The following network communities show in digests, which emoji are often used together in email subject lines (e.g. French Fries and the Hamburger in the 8th image). Below each emoji is the unicode, which you can type to insert it into your emails. For example, hold the ALT key, press + on the num pad and then 2 6 f 3 to get the ‘flag in hole’ character ⛳ from image no. 15.

rabbit face, four leaf clover, sunflower, cherry blossom, herb, tulip, …

memo, graduation cap, pencil, books, closed book, open book, …

smiling face with open mouth, smiling face with heart-shaped eyes, thumbs up sign, grinning face, smiling face with open mouth and smiling eyes, party popper, …

white heavy check mark, personal computer, mobile phone, white right pointing backhand index, double exclamation mark, squared new, …

airplane, rocket, sunrise over mountains, sunrise, ship, sailboat, …

black sun with rays, sun with face, footprints, earth globe americas, white medium star, earth globe europe-africa, …
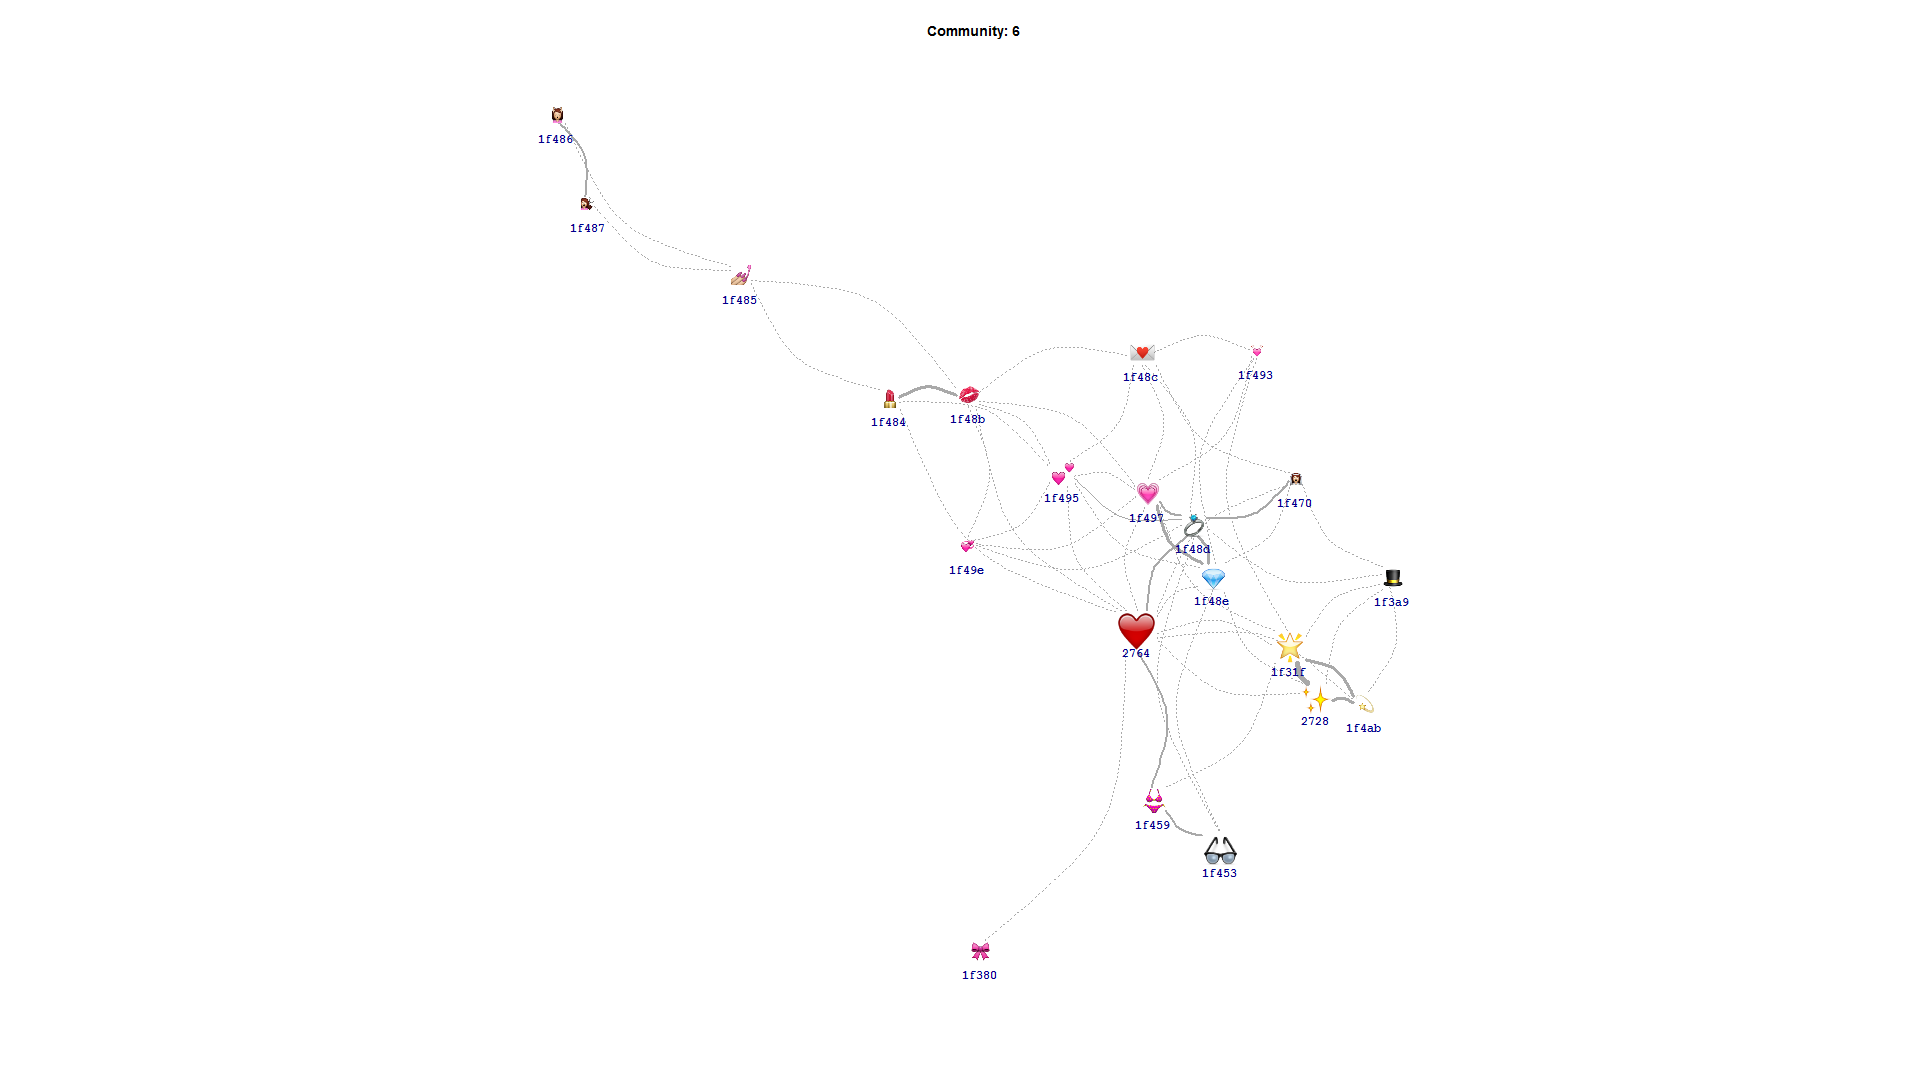
heavy black heart, eyeglasses, glowing star, sparkles, bikini, gem stone, …

fork and knife, wine glass, cocktail glass, clinking beer mugs, slice of pizza, tropical drink, …

alarm clock, black rightwards arrow, calendar, incoming envelope, electric light bulb, e-mail symbol, …

hot beverage, doughnut, shortcake, chocolate bar, cookie, honey pot, …

automobile, bicycle, recreational vehicle, delivery truck, oncoming automobile, package, …

woman, man, baby, girl, boy, older woman, …

multiple musical notes, musical note, guitar, microphone, headphone, alien monster, …

dress, high-heeled shoe, t-shirt, briefcase, handbag, womans clothes, …

trophy, soccer ball, basketball and hoop, crown, tennis racquet and ball, flag in hole, …

red apple, green apple, strawberry, watermelon, tomato, ear of maize, …

fish, octopus, dolphin, tropical fish, spouting whale, whale, …
Source code to create the community images
I used the following code to produce the 17 images. You can copy and paste it into your R console to reproduce the output. The code contains some overhead because it also installs the required R packages and downloads and unpacks @dataNeel’s archive. After that, it finally exports the PNGs above:
install.packages(c("igraph", "png", "plotrix"))
source("http://bioconductor.org/biocLite.R")
biocLite("EBImage")
## Second, download @dataNeel's zip (http://blog.mailchimp.com/mailchimps-most-popular-subject-line-emojis/#comment-3156765),
## unzip it and save the path to the files in a variable `path`:
fn <- "https://www.dropbox.com/s/lee3eh97lev61ja/MailChimp_emoji_graphml.zip?dl=1"
download.file(url = fn, destfile = tf <- file.path(tempdir(), basename(sub("(.*)\\?.*", "\\1", fn))), mode = "wb")
unzip(tf, exdir = tempdir())
path <- file.path(tempdir(), "MailChimp_emoji_graphml")
if (all(
# only proceed, if all required packages can be loaded...
library(igraph, logical.return = TRUE) &
library(png, logical.return = TRUE) &
library(plotrix, logical.return = TRUE) &
library(EBImage, logical.return = TRUE) )) {
## load graphml export from gephi into R:
g <- read.graph(file = file.path(path, "MailChimp_emoji_pairs.graphml"), format = "graphml" )
## Declutter the map a bit by deleting less important (?) edges and nodes:
g <- delete.edges(g, which(E(g)$weight < 10))
g <- delete.vertices(g, which(degree(g) < 3))
## detect emoji communities using random walks (fast!)
set.seed(1)
com <- walktrap.community(g, weights = E(g)$weight)
m <- community.to.membership(g, com$merges, steps = which.max(com$modularity)-1)
V(g)$membership <- membership(m)
## Define the plotting function:
plotEmojis <- function(sg) {
# load emoji pictures
V(sg)$raster <- lapply(file.path(path, V(sg)$Image), readPNG)
# convert b&w images to rgb images (otherwise plot.igraph throws an error)
V(sg)$raster[sapply(V(sg)$raster, dim)[3,] < 3 ] <-
lapply(V(sg)$raster[sapply(V(sg)$raster, dim)[3,] < 3 ], function(x) {
channel(x, "rgb")
})
# plot the network using a force-based algorithm
plot.igraph(
x = sg, layout = layout.fruchterman.reingold(sg, weights = E(sg)$weight),
vertex.shape = "raster",
vertex.label = sub("(.*).png", "\\1", V(sg)$Image), vertex.label.family = "mono", vertex.label.font = 2, vertex.label.degree = pi/2, vertex.label.dist = .3,
vertex.size = rescale(V(sg)$size, c(3, 10)), vertex.size2 = rescale(V(sg)$size, c(3, 10)),
edge.lty = ifelse(E(sg)$weight > quantile(E(sg)$weight, .75), "solid", "dotted"), edge.width = rescale(E(sg)$weight, c(1, 5)), edge.curved = TRUE
)
}
# Loop through communities with more than 5 nodes and export subgraphs as PNGs into the working directory:
for (community in (which(sizes(m) > 5)-1)) {
png(paste0("emoji_community_no_", community, ".png"), width = 1920, height = 1080)
plotEmojis(suppressWarnings(subgraph(g, V(g)$membership == community)))
title(main = paste0("Community: ", community))
dev.off()
}
}
Recreating the original emoji map using R
… is also possible. Try this code snippet, to get a map similar to that from the MailChimp website:
if (all(sapply(c("igraph", "png", "plotrix", "EBImage"), require, character.only = TRUE))) { # only proceed if all required packages can be loaded
g <- read.graph(file = file.path(path, "MailChimp_emoji_pairs.graphml"), format = "graphml" ) # read graphml file
V(g)$raster <- lapply(file.path(path, V(g)$Image), readPNG) # read image files
V(g)$raster[sapply(V(g)$raster, dim)[3,] < 3 ] <- # convert b/w images to rgb (some loose transparency... :-( )
lapply(V(g)$raster[sapply(V(g)$raster, dim)[3,] < 3 ], function(x) {
channel(x, "rgb")
})
V(g)$size <- rescale(V(g)$size, c(.5, 2)) # normalize image sizes
png("mailchimp_emoji_r.png", 1920, 1080) # open PNG
plot(delete.edges(g, which(E(g)$weight <= quantile(E(g)$weight, .9))), # plot and delete most of the edges (declutter)
vertex.shape = "raster", vertex.size = V(g)$size, vertex.size2 = V(g)$size, # setup images
margin = rep(-.82, 4), # zoom in
edge.curved = .8, edge.color = "#EEEEEE") # draw curved gray edges
dev.off() # save & close PNG
shell.exec("mailchimp_emoji_r.png") # open image file on windows using the associated application
}

Interactive networks, anyone?
Or, if you want to get fancier, build an interactive network from a subset of nodes:
g <- read.graph(file = file.path(path, "MailChimp_emoji_pairs.graphml"), format = "graphml" )
g <- suppressWarnings(subgraph(g, grep("(?:dress|shoe|shirt|bag|cloth)|(?:apple|strawberry|melon|tomato)", V(g)$id)))
set.seed(1)
com <- edge.betweenness.community(g, weights = E(g)$weight)
edges <- transform(get.data.frame(g, "edges")[, c("from", "to", "weight")], from = from - 1, to = to - 1)
nodes <- transform(get.data.frame(g, "vertices")["id"], group = membership(com))
if (library(networkD3, logical.return = TRUE)) {
saveNetwork(
forceNetwork(Links = edges, Nodes = nodes, charge = -220,
Source = "from", Target = "to", Group = "group",
Value = "weight", NodeID = "id", opacity = 0.8),
file = "apples_and_dresses.html", selfcontained = TRUE)
}
shell.exec("apples_and_dresses.html")